Nivaldo Soria P.A. & Claudia Serpa P.A.


SALES SUMMARY 2018 _______ In the graph below, we are able to appreciate the monthly sales activities and the sold price per square foot of single family homes in North Bay Village last year (2018).Please review it carefully to understand which months showed the highest volume of sales and price per square...
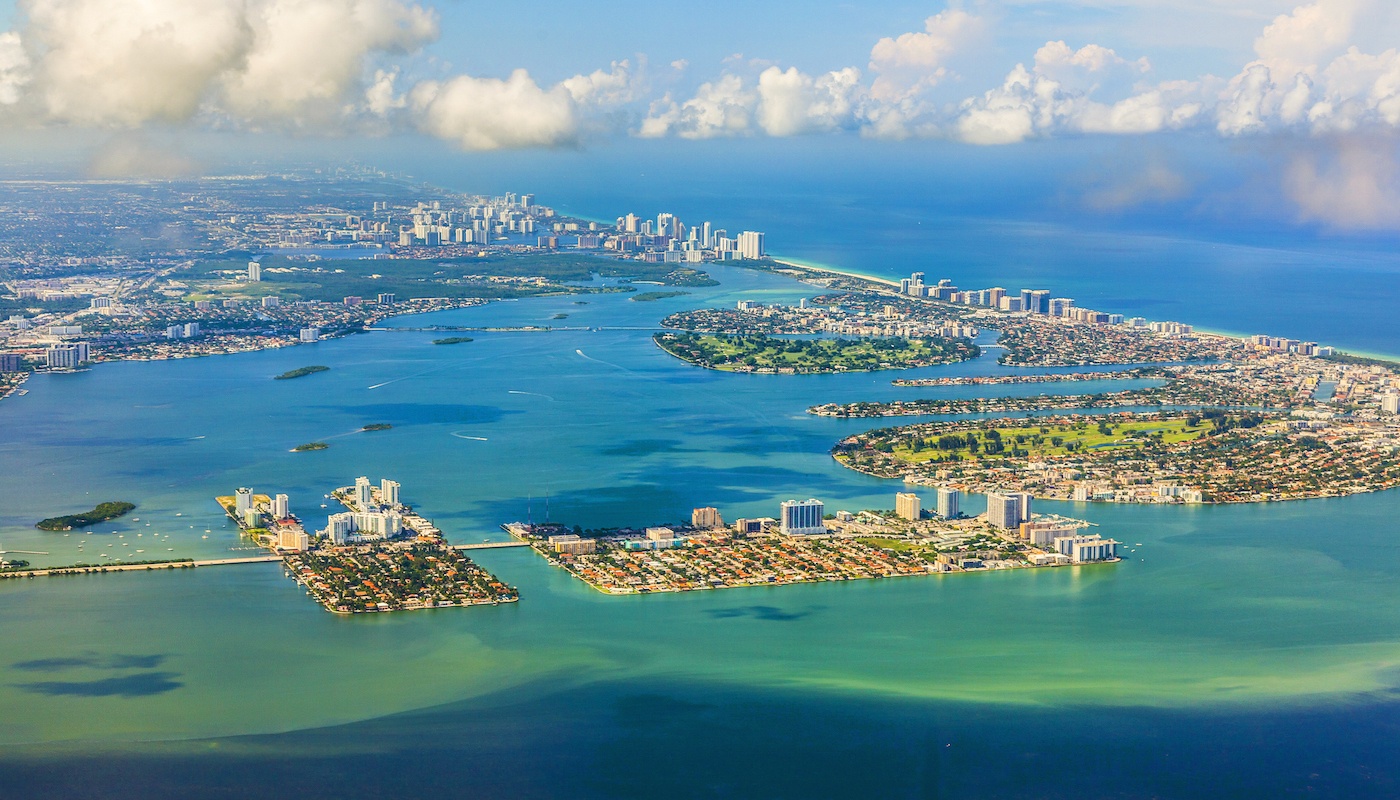
...read moreLeer en Español First Quarterly Report & Market Trends2018 HOMES SOLD The waterfront homes market did great in North Bay Village in this first quarter of 2018. A total of 2 properties were sold. These single family homes sold for an average price per square foot of $580. Even though we cannot...
...read morePrimer Informe Trimestral y Tendencias del Mercado2018 CASAS VENDIDAS El mercado de casas con acceso directo a la bahía estuvo grandioso en North Bay Village en este primer trimestre del 2018. Se vendieron un total de 2 hogares. Estas casas se vendieron por un precio promedio de $580 por pie cuadrado....
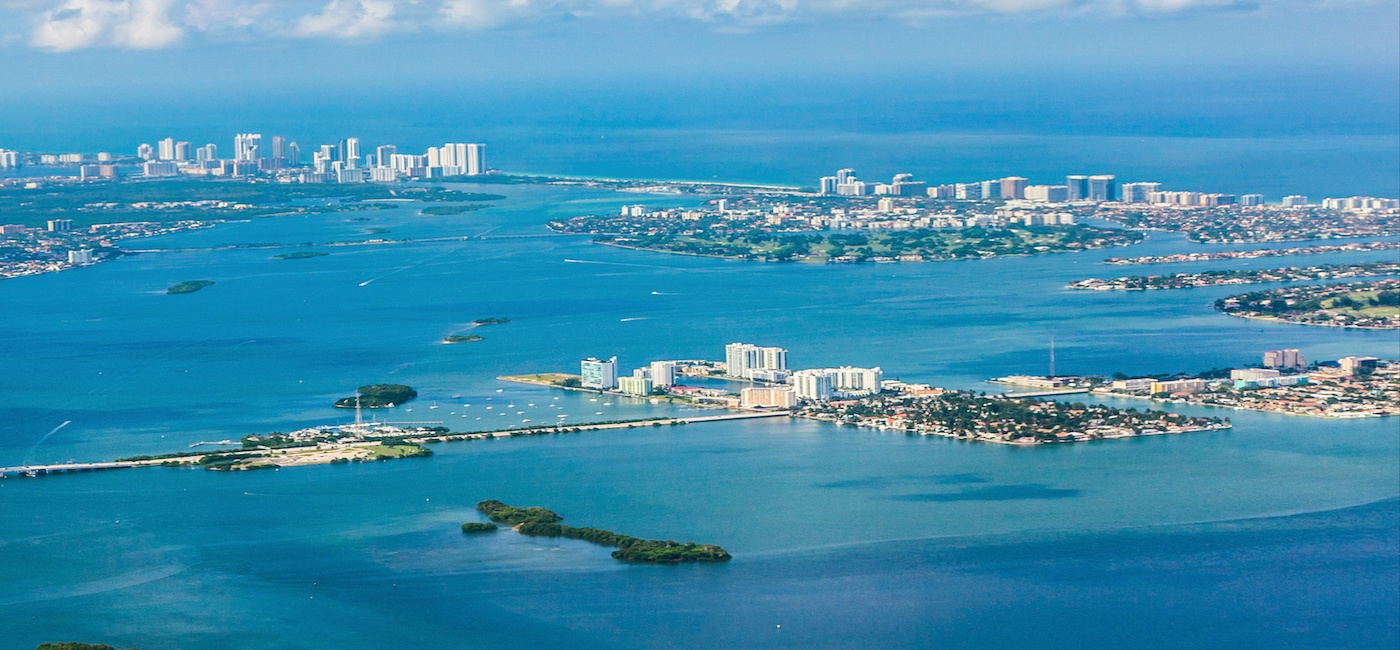
...read moreLeer en Español Fourth Quarterly Report & Market Trends2017 HOMES SOLD Unfortunately, none of the active waterfront homes for sale in North Bay Village were sold during this past quarter of 2017. On 2015’s fourth quarter, one house was sold for $632 per square foot, and also, one was sold in 2016,...
...read moreCuarto Informe Trimestral y Tendencias del Mercado2017 CASAS VENDIDAS Desafortunadamente, ninguna de las casas con acceso a la bahía activas para la venta en North Bay Village se vendió durante el último trimestre del 2017. En el cuarto trimestre del 2015, se vendió una casa por $632 por pie cuadrado y...
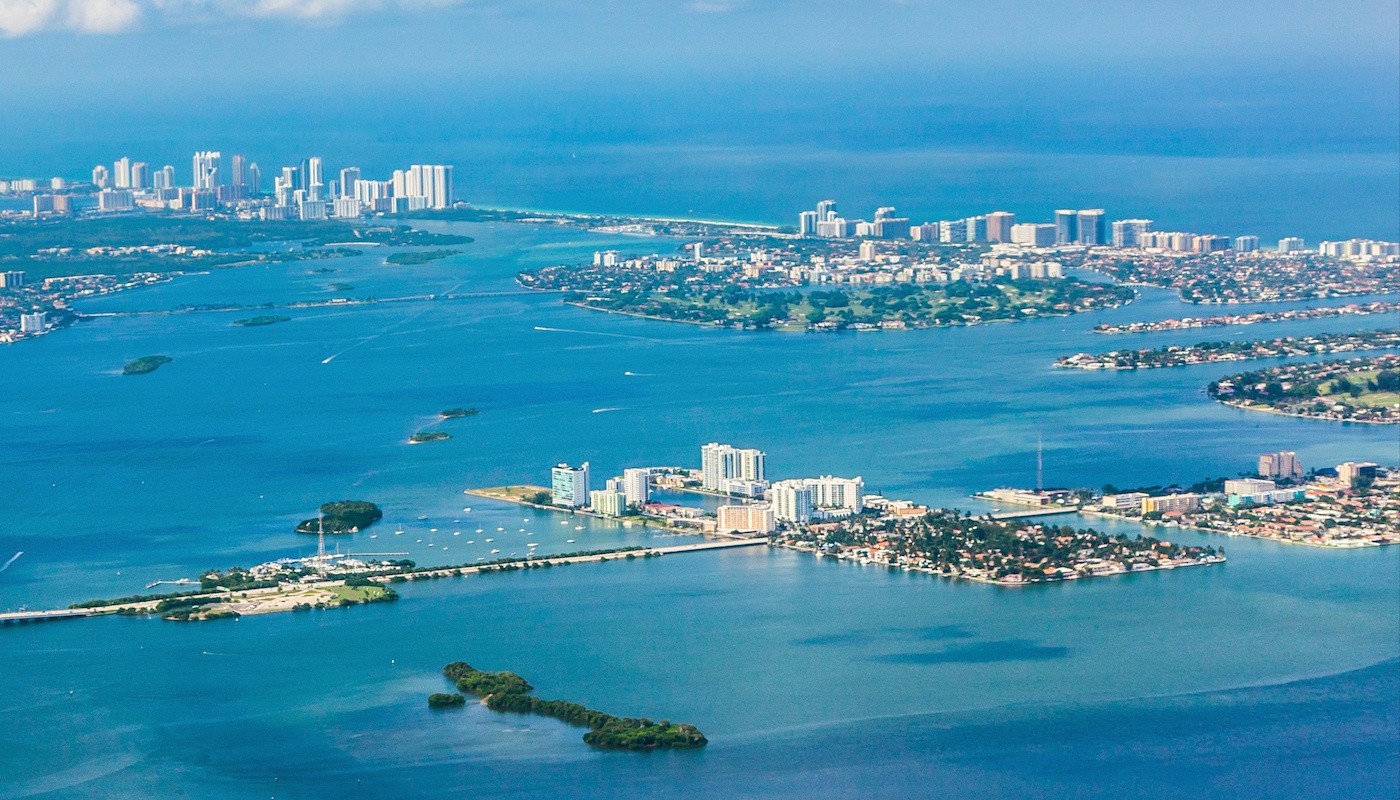
...read moreTercer Informe Trimestral y Tendencias del Mercado 2017 CASAS VENDIDAS El siguiente gráfico compara las viviendas con acceso a la bahía vendidas durante el tercer trimestre de los años 2015, 2016 y 2017 en North Bay Village. Desafortunadamente, no se vendió ninguna casa este último trimestre....
...read moreThird Quarterly Report &Market Trends 2017 HOMES SOLD On the following table, we can notice a consistency in the number of waterfront homes sold during the second quarter of years 2017, 2016 and 2015. However, we can appreciate a 40% increase in the...
...read moreSegundo Informe Trimestral y Tendencias del Mercado 2017 CASAS VENDIDAS En la siguiente tabla podemos observar una consistencia en el número de casas con acceso a la bahía vendidas durante el segundo trimestre de los años 2017, 2016 y 2015. Sin embargo, podemos apreciar un aumento...
...read moreSecond Quarterly Report & Market Trends 2017 HOMES SOLD On the following table, we can notice a consistency in the number of waterfront homes sold during the second quarter of years 2017, 2016 and 2015. However, we can appreciate a 40% increase in the...
...read more1- ¿Estás Motivado en Vender? 2- ¿Deberias Contrator un Agente? 3- ¿Dónde se Encuentran los Agentes Adecuados para Entrevistar? 4- ¿Cómo saber si estás Contratando el Agente Correcto? 5- Escogiendo el Precio Correcto de Listado para su Propiedad. 6- La apariencia de su Propiedad en Internet es...
...read more

Broker
South Florida Investments
305-219-8343 Direct
7867697956
305-513-5670 Fax
1666 Kennedy Causeway Suite 606
North Bay Village, FL 33141
Realty Net Media IDX
